
Insights
The Insight page serves as a comprehensive hub for assessing the cryptocurrency market. It consolidates a variety of data points—ranging from total market capitalization, total value locked (TVL), and trading volume, to more advanced analytics like market sentiment trends, token screener tools, and visualized token performances. By blending key metrics with intuitive data visualization and analysis features, Insight helps users form a clearer picture of the entire crypto landscape.
Overview of the Key Metrics
This section helps user navigate and interpret the most important data displayed on the Insight page. Whether you’re looking for a high-level market overview or diving into specific sectors, these features give you a clear, user-friendly snapshot of the crypto landscape.
1. Market Trend
Coin 360
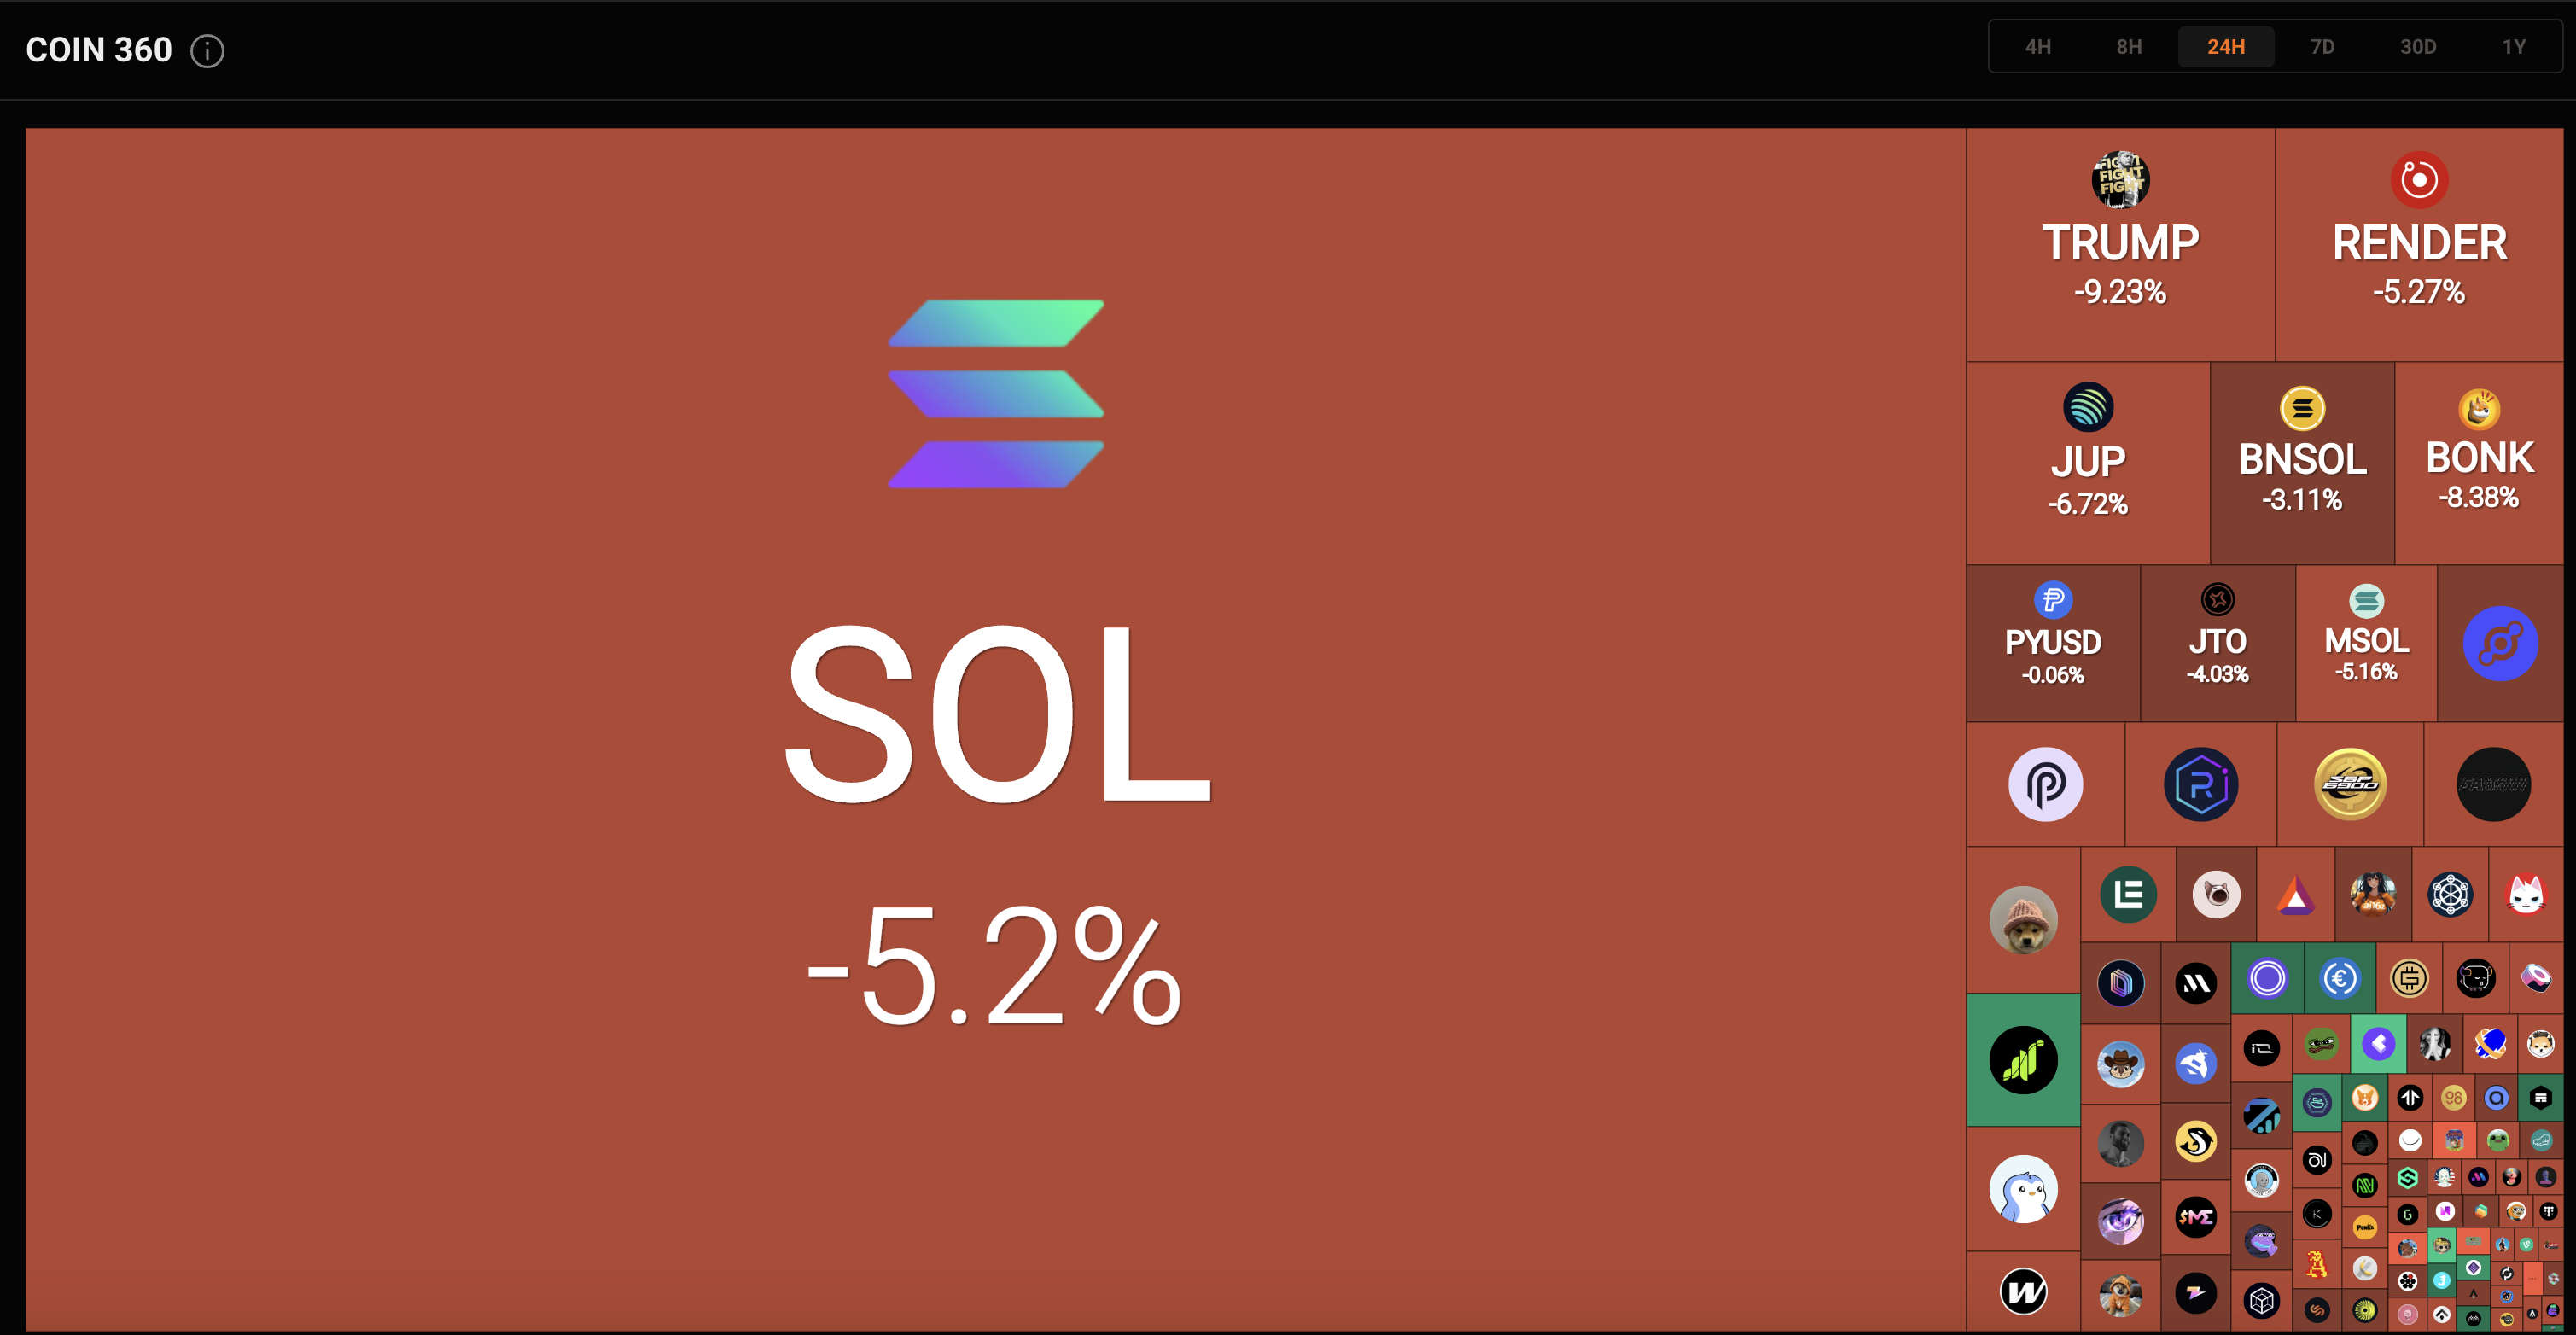
- What It Is: A heatmap highlighting the top 100 cryptocurrencies by market cap, presented in an easy-to-scan visual format.
- Why It Matters: Each token’s size reflects its market share, and color indicators quickly show price gains or losses—so you can instantly gauge the overall market sentiment.
- Data Integrity: Only tokens officially listed on reputable sources (like CoinGecko or CoinMarketCap) are included, helping you avoid spam or low-credibility projects.
Bubble Chart
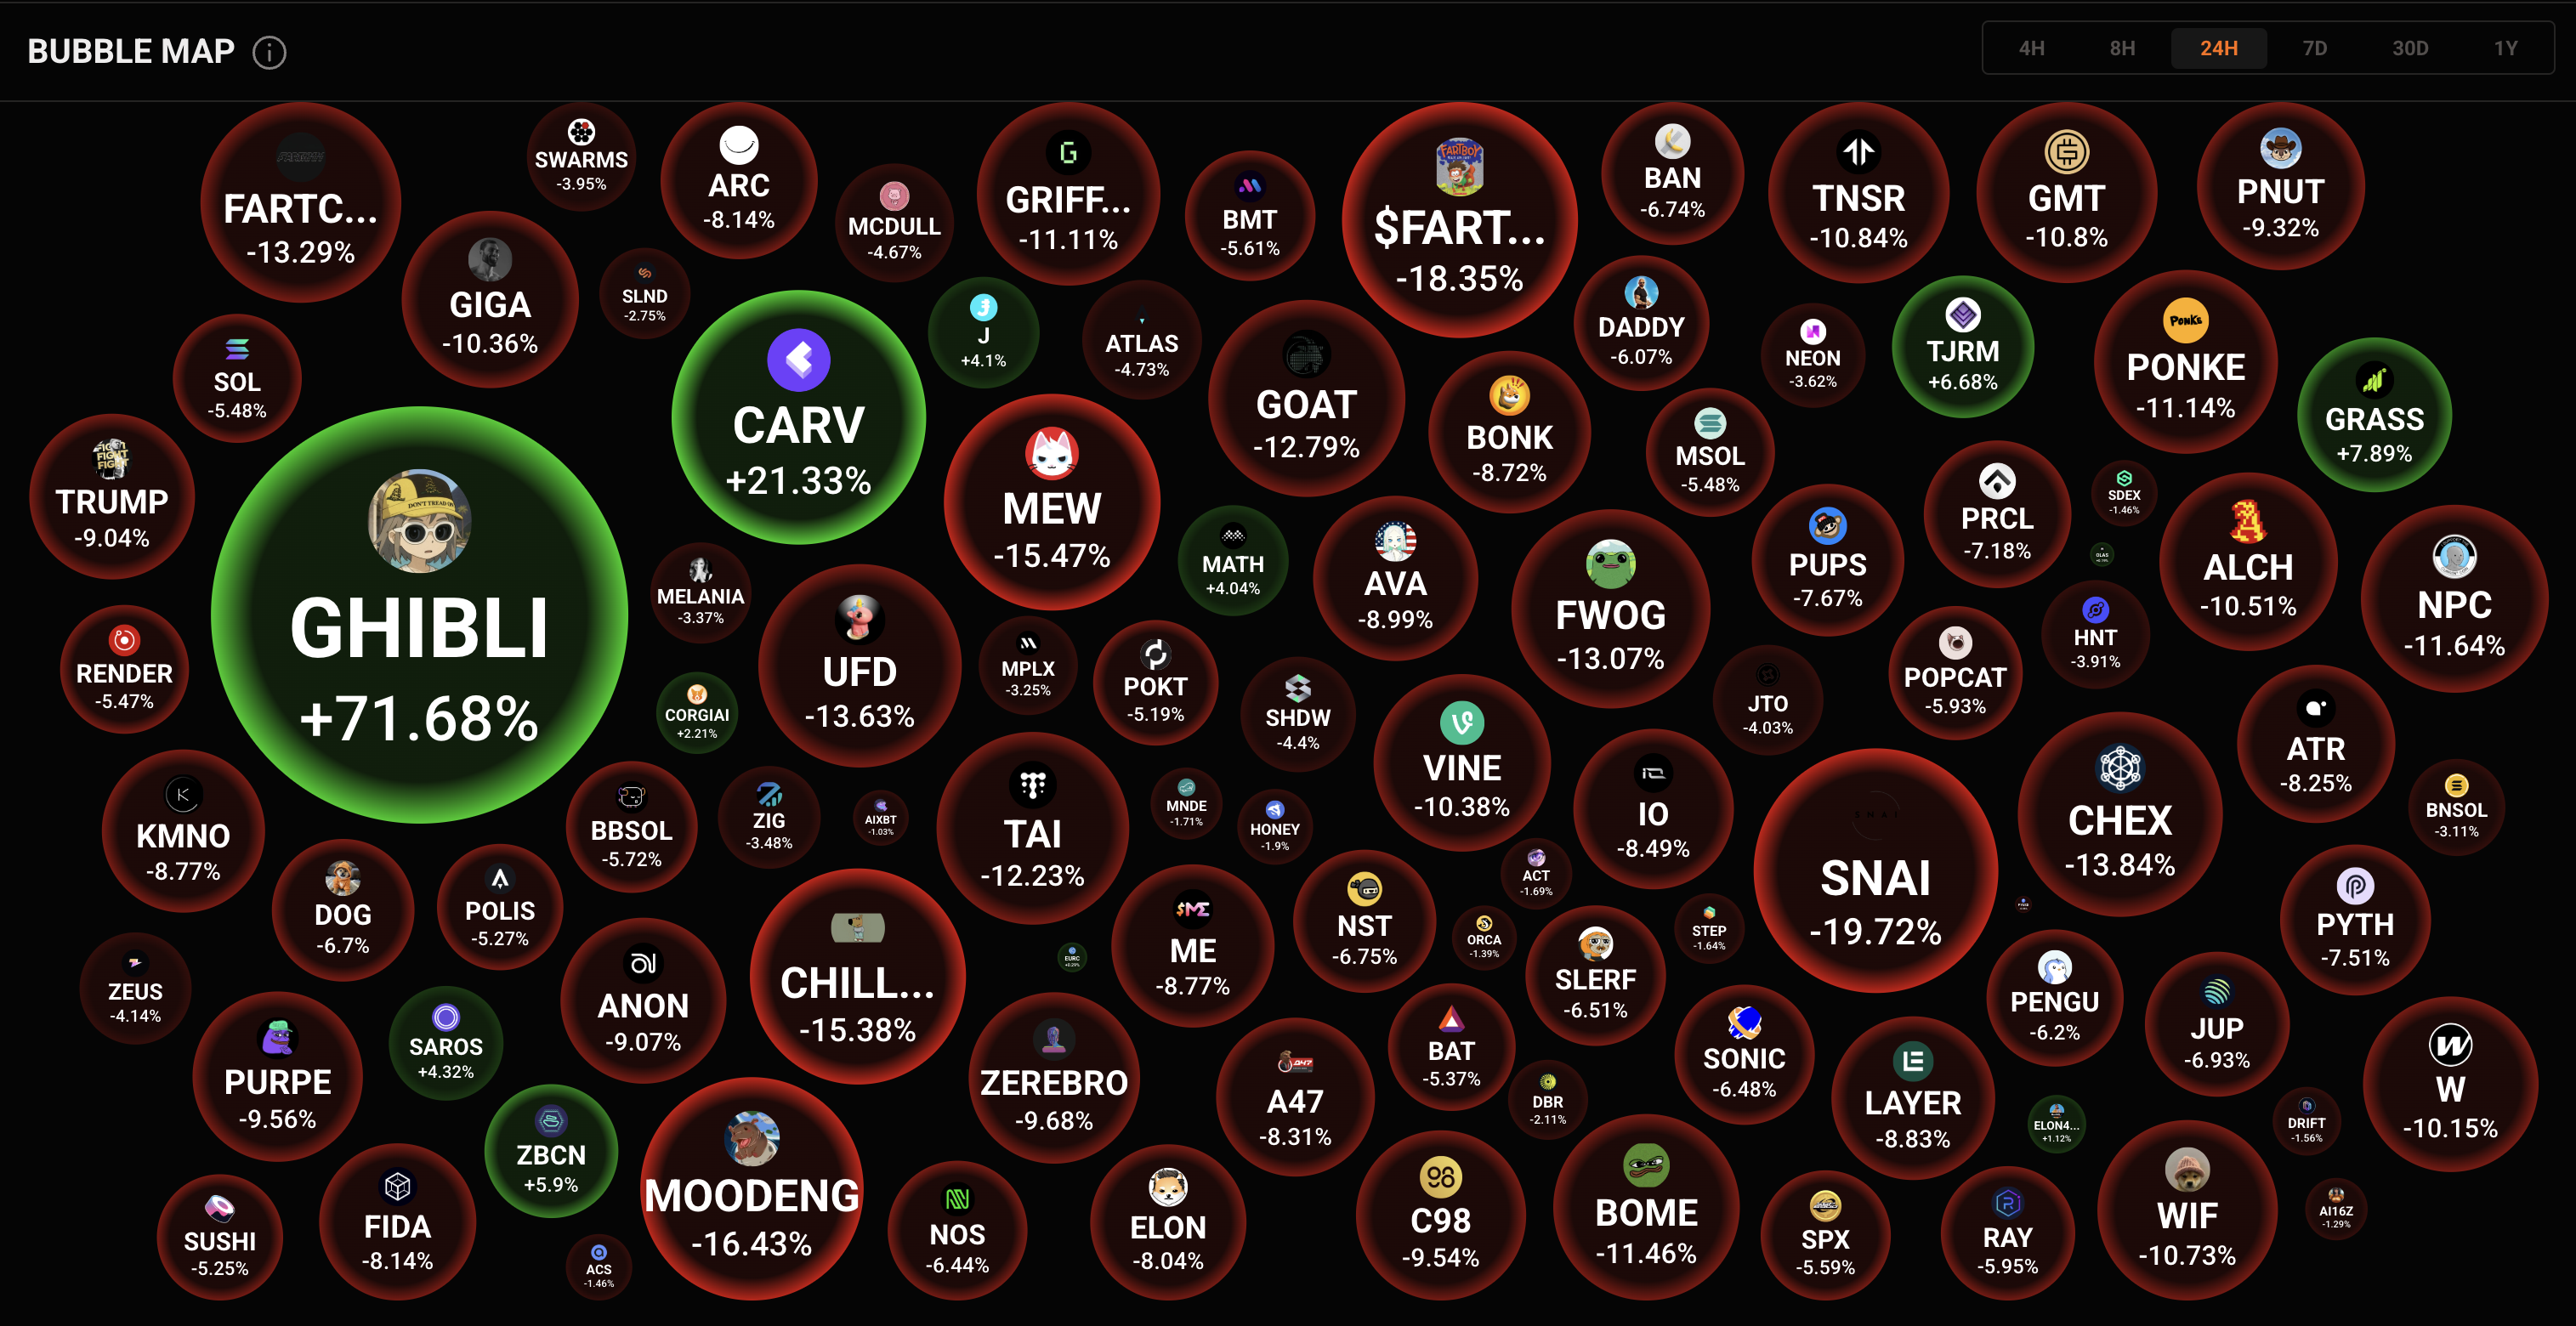
- What It Is: Another visualization of the top 100 tokens by market cap, where each token is represented as a bubble.
- How It Helps: The bubble size indicates market cap; color or position can show price movements or other metrics. This makes it easy to see which coins dominate the market and how they stack up against one another.
- Filtering: Just like Coin 360, this chart excludes tokens not recognized by major market data sources.
Native Token Performance
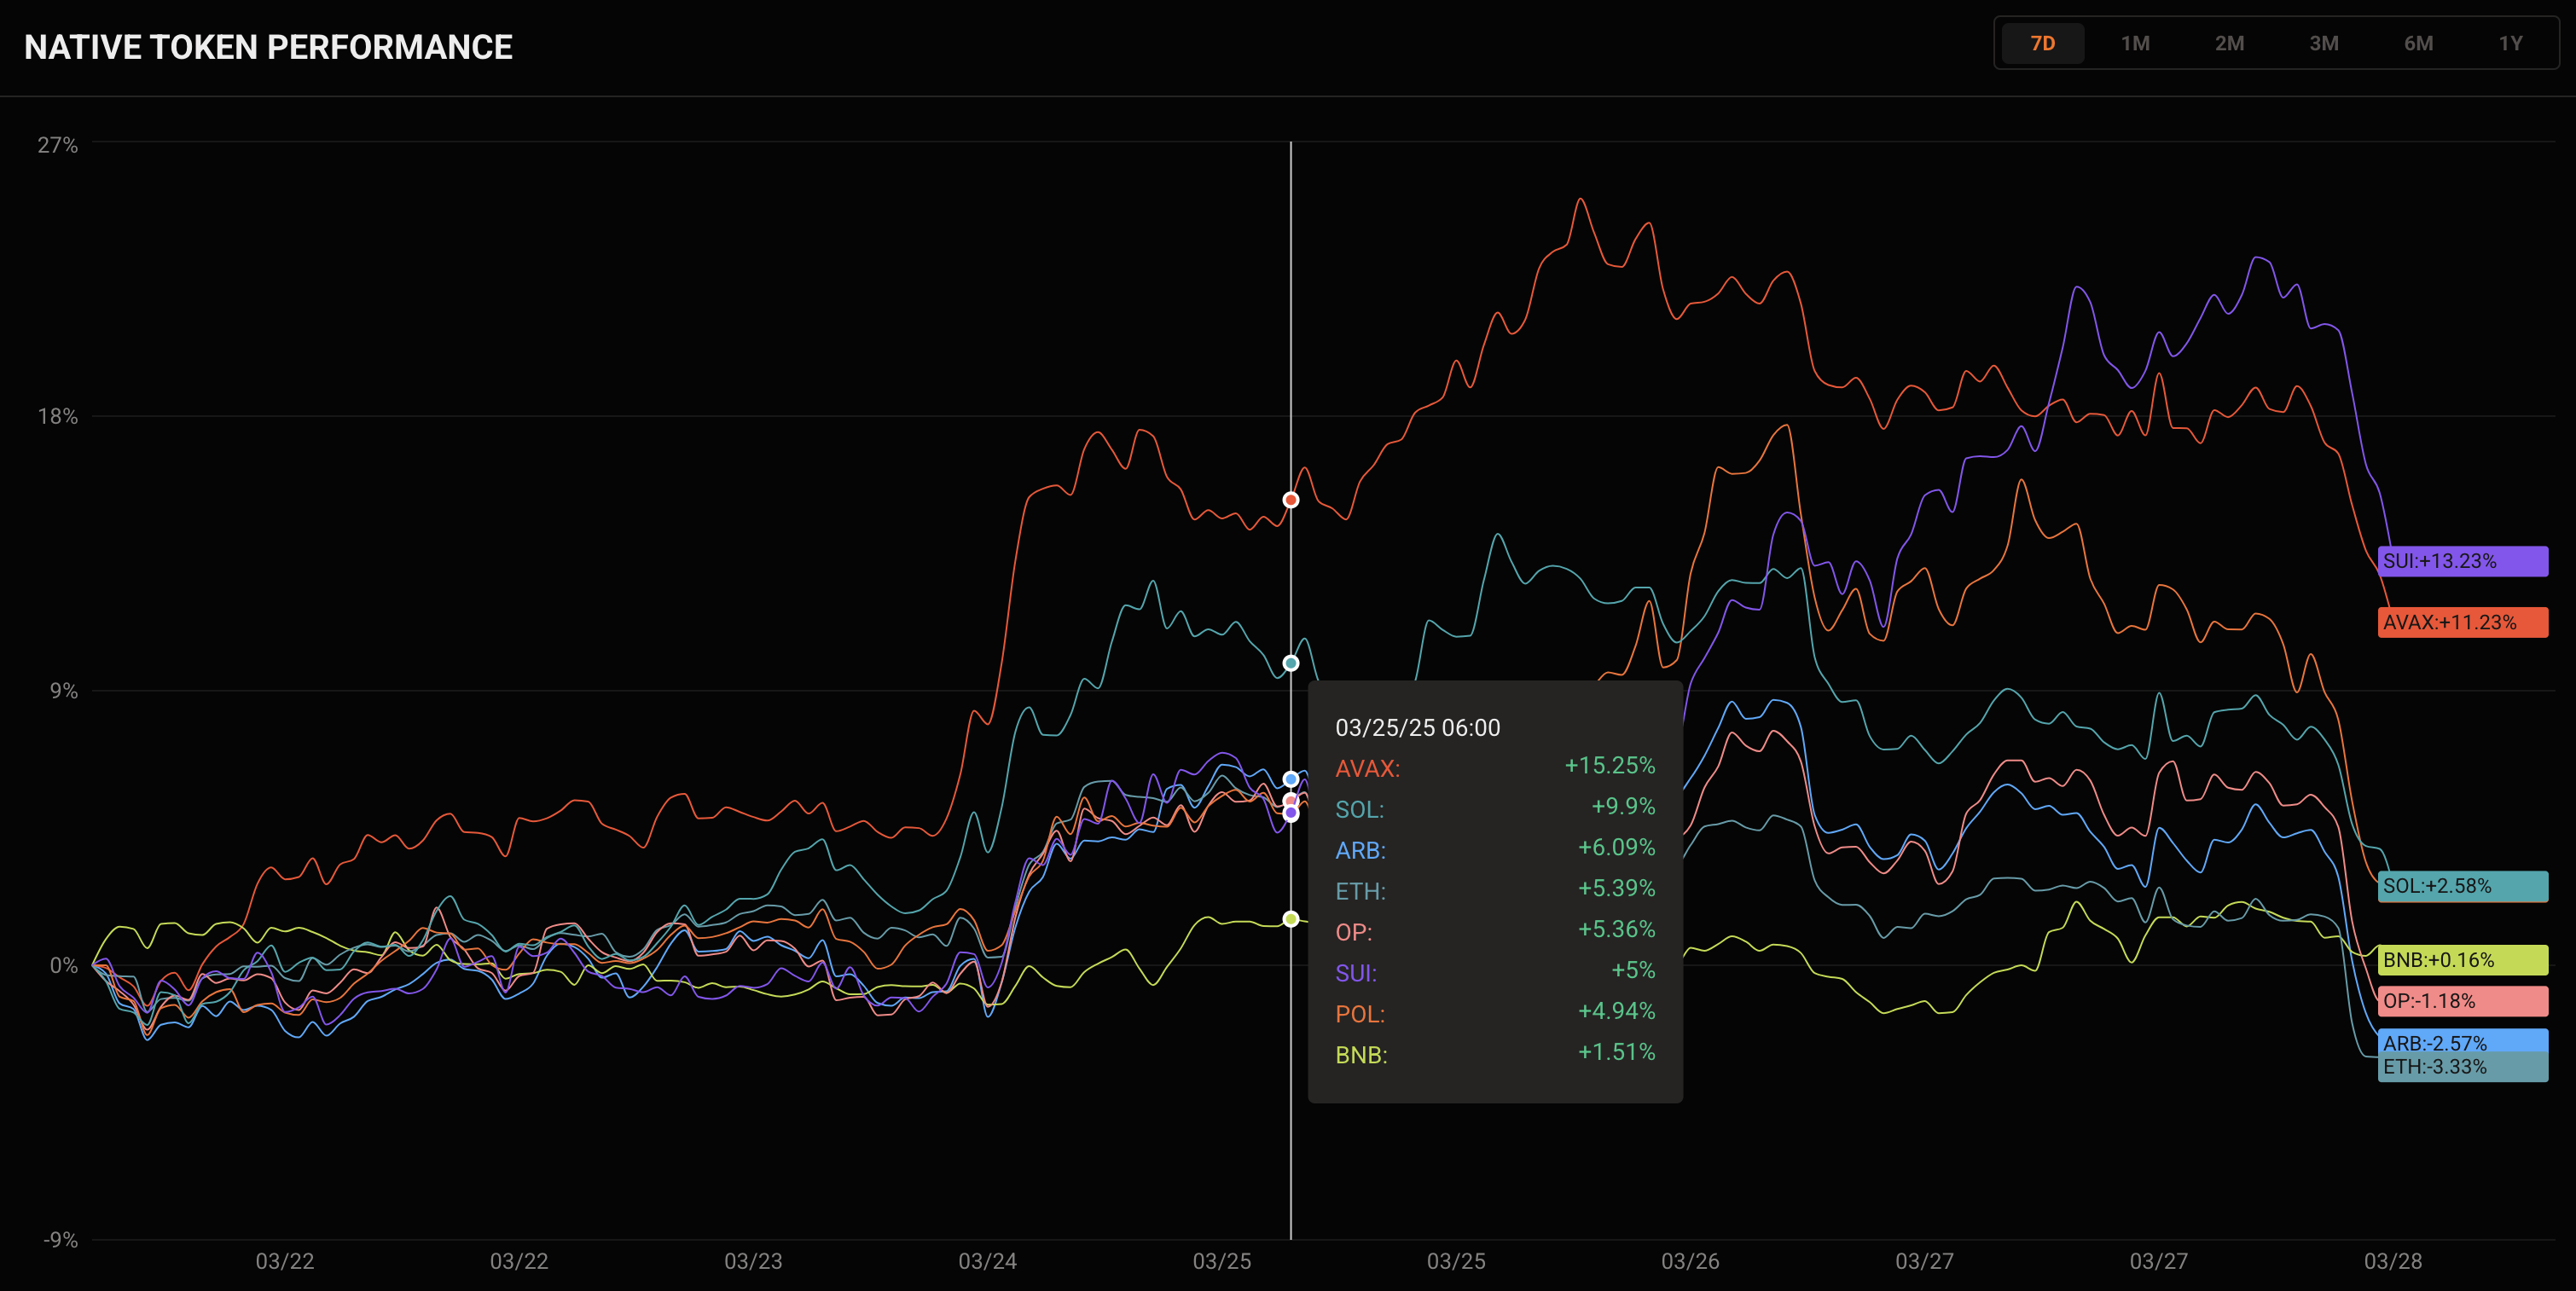
- What It Covers: Shows how the main tokens of various blockchains (Layer 1s and Layer 2s) are performing over specific timeframes.
- Why You Need It: If you’re comparing, for example, Ethereum vs. BNB Chain vs. newer chains, this section clarifies which ones are gaining or losing momentum in real time.
Crypto Visual Screener
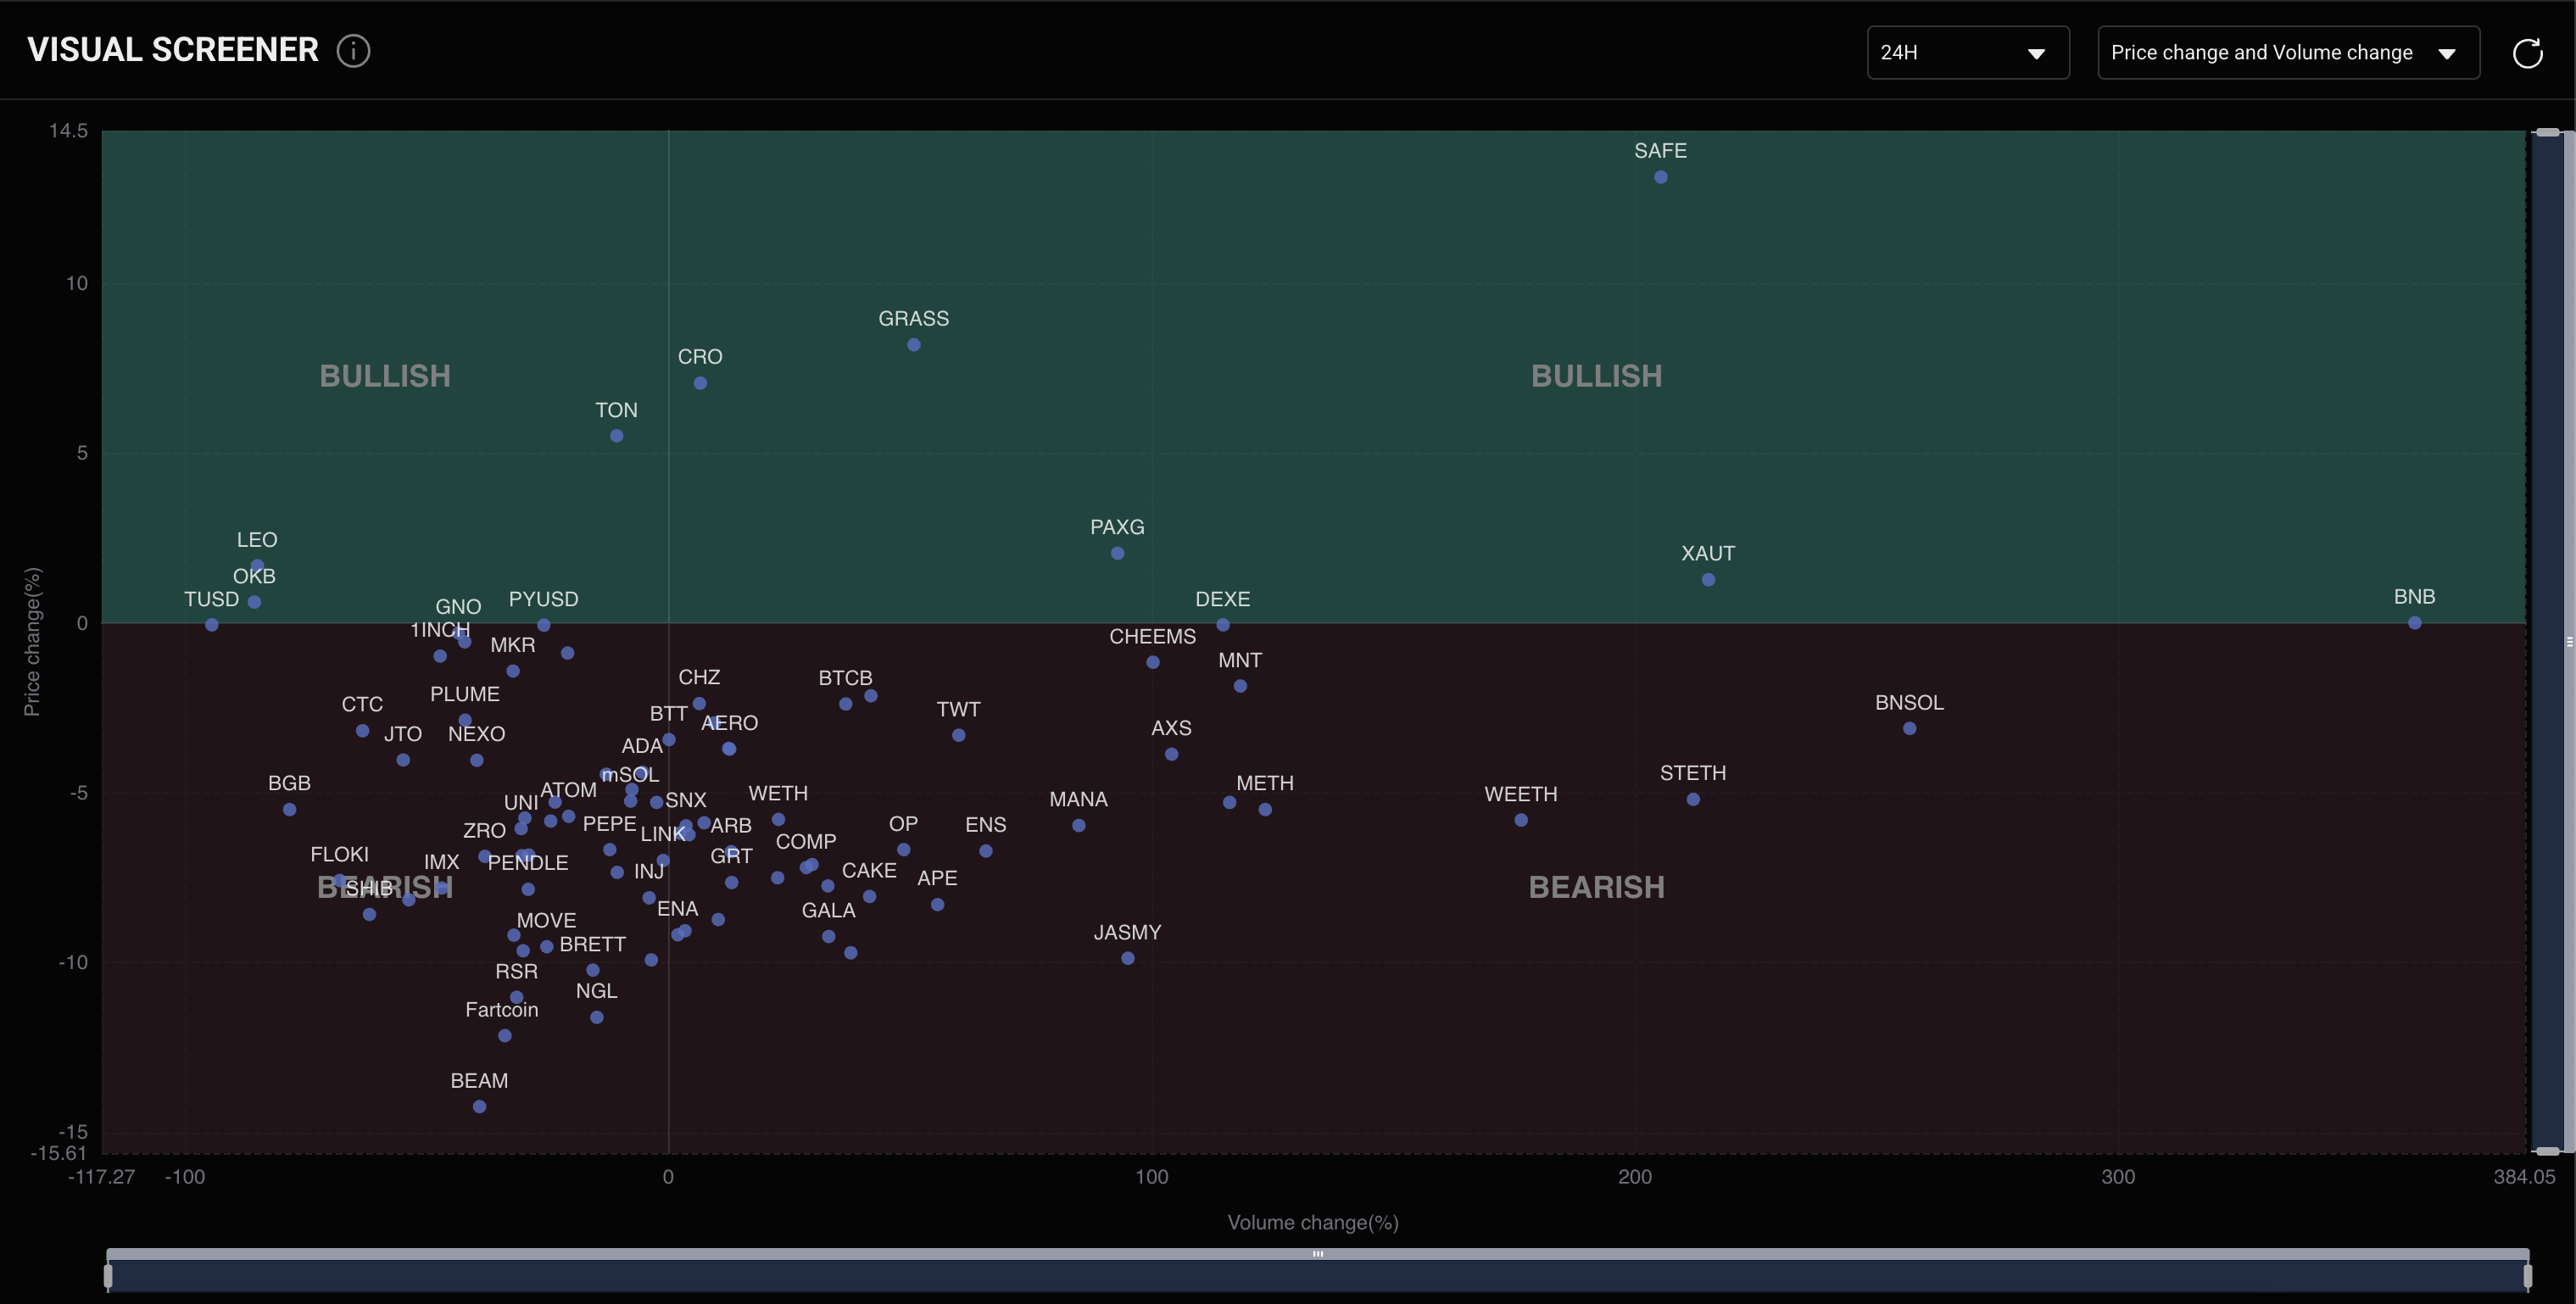
- What It Does: Offers an interactive, customizable way to filter and sort tokens based on metrics like trading volume, market cap, and price changes.
- Why It’s Useful: Quickly pinpoint tokens experiencing significant price swings, large volume spikes, or any other notable trend—all in a single, user-friendly interface. This is especially helpful for spotting new opportunities or potential market shifts.
2. Industries
Overview of All Sectors
- Sector Heatmap
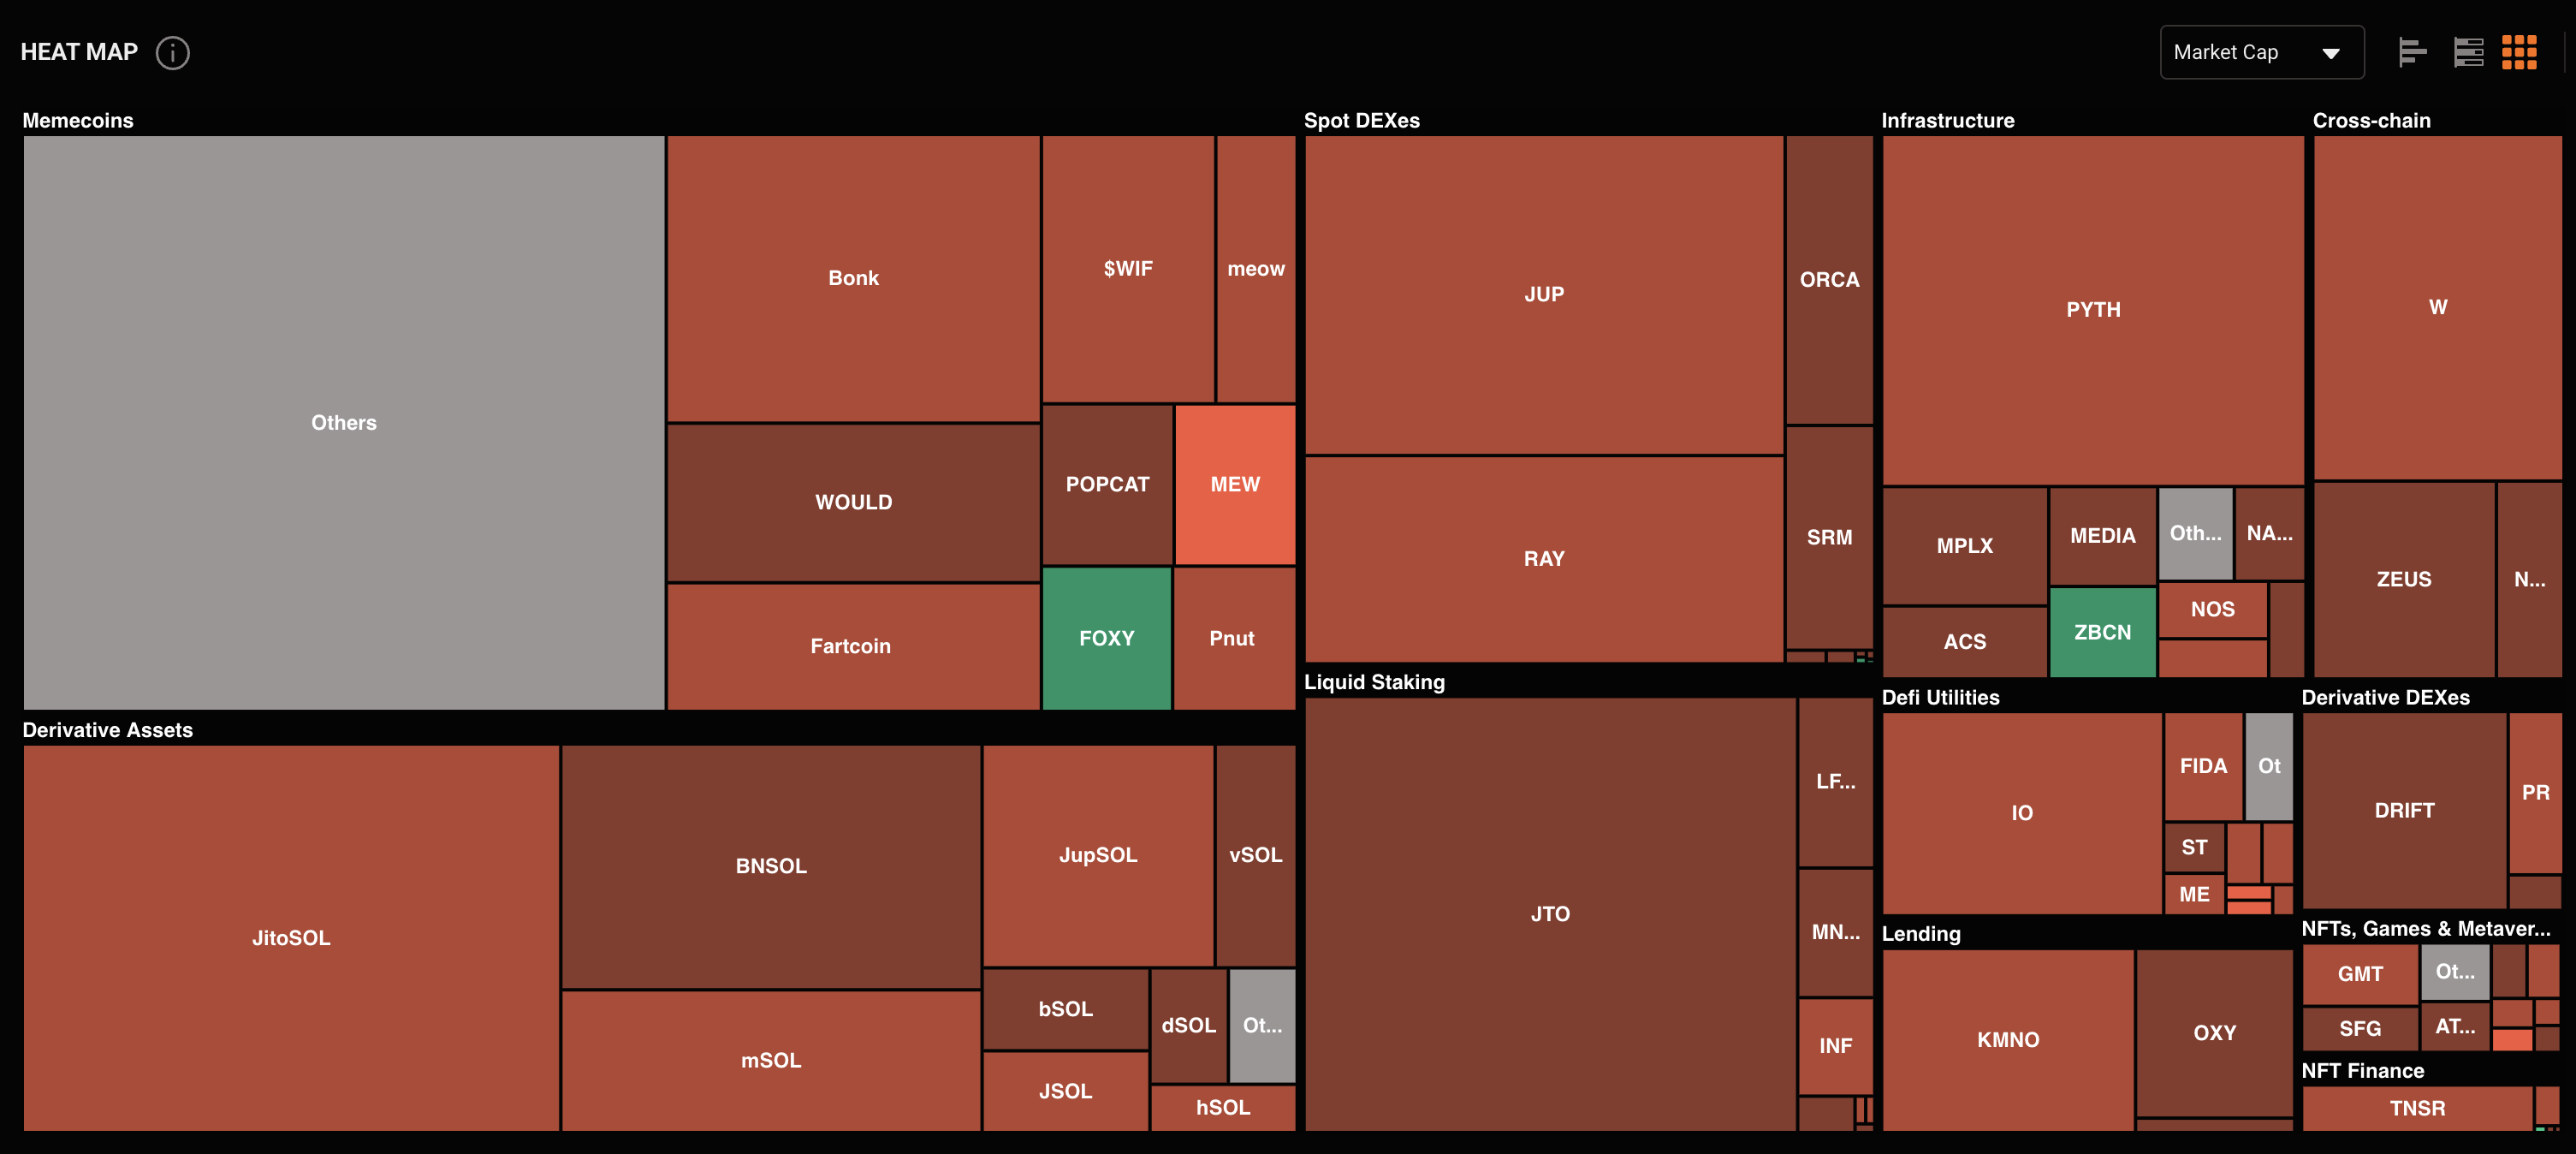
A color-coded snapshot of how each sector (e.g., DeFi, GameFi, NFTs) is performing, based on aggregated token data.
- Historical Sector Dominance
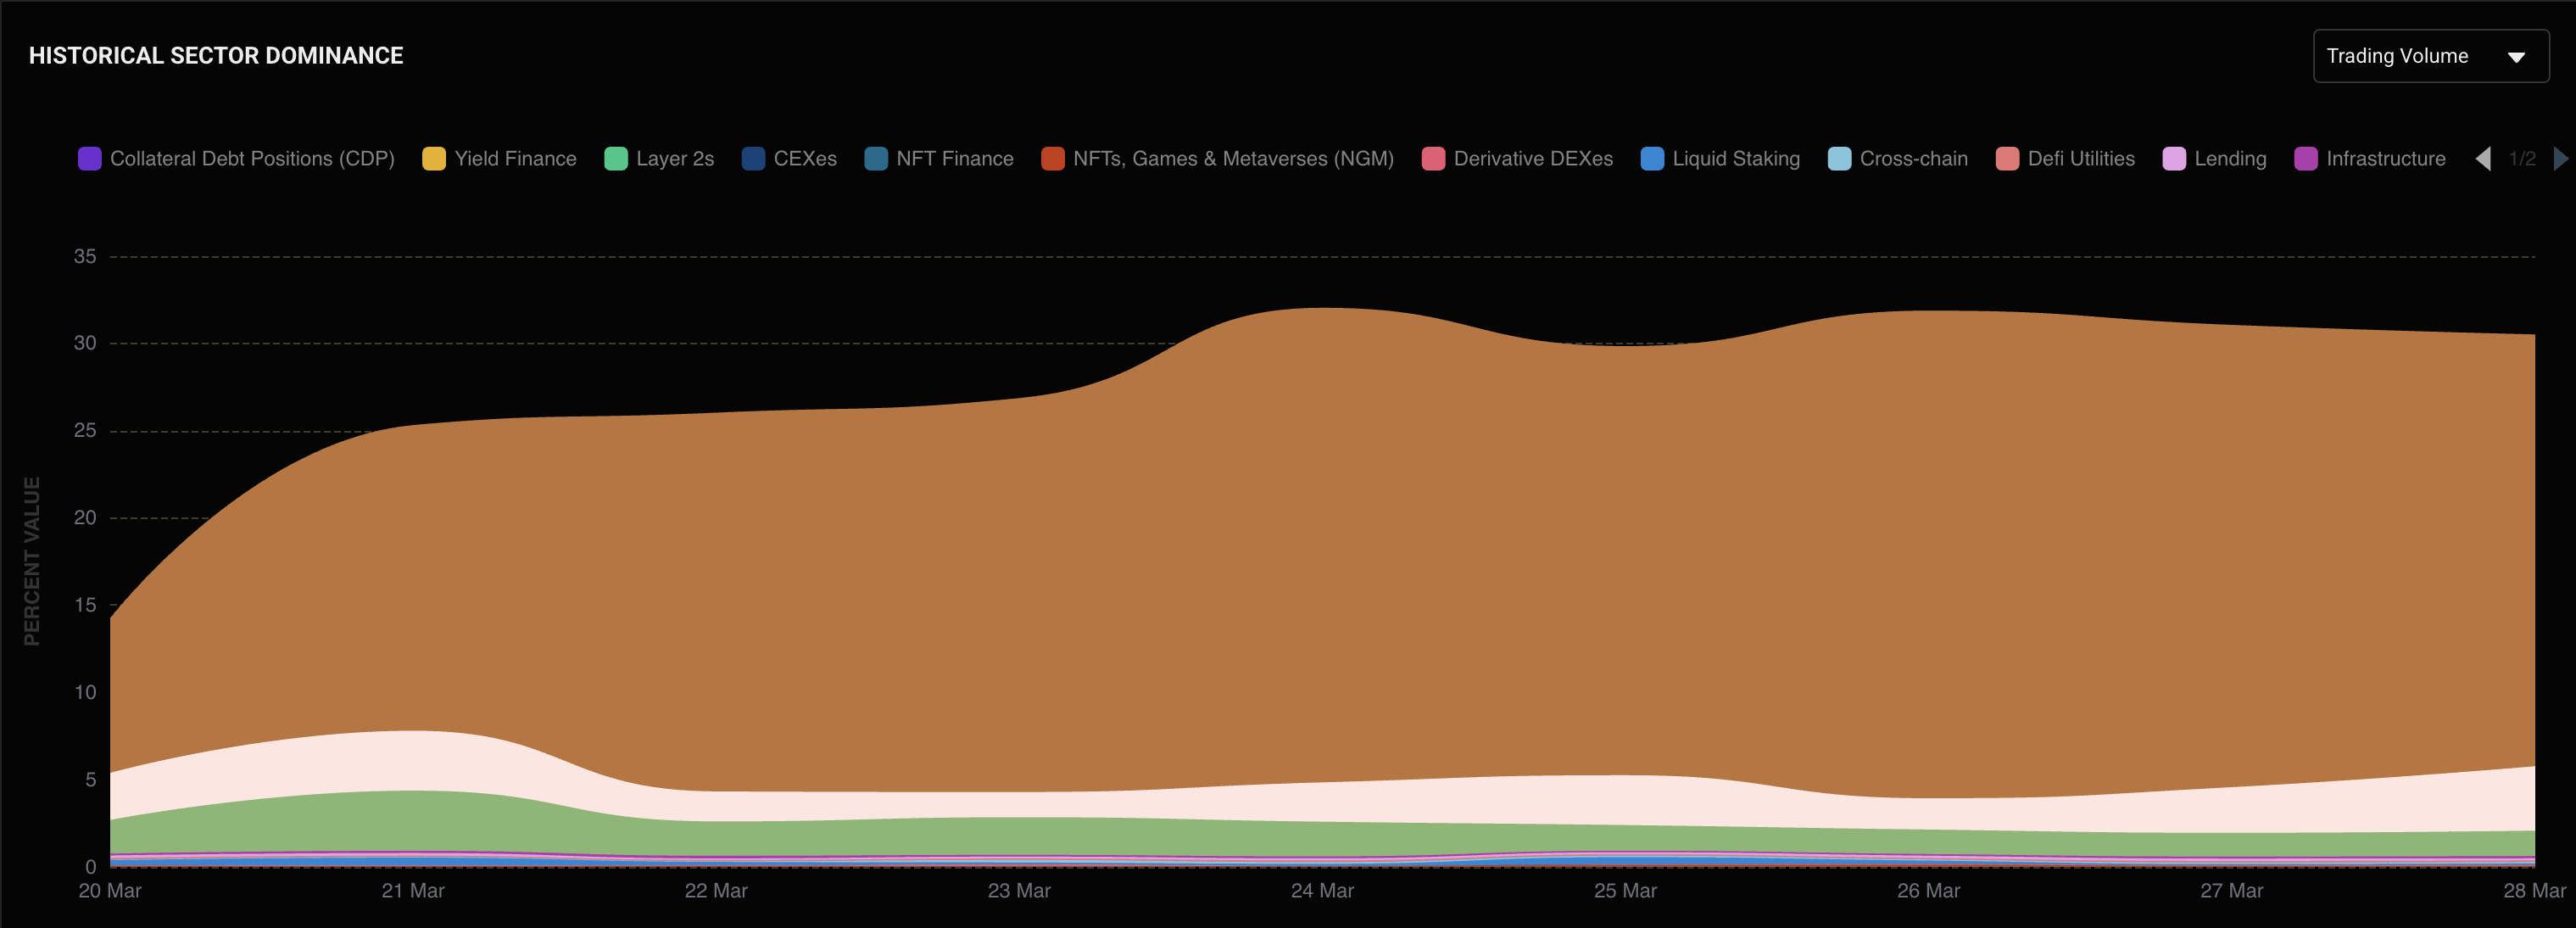
How each sector’s share of total market cap, volume, or TVL has changed over time. This shows you which areas are growing or fading in influence.
- A metric that summarizes sector performance, making it easy to compare at a glance—think of it like a quick score for each sector’s overall health.
- Price Performance by Sector: Displays how many tokens in each sector have risen or fallen within a given timeframe, helping you spot sectors on the upswing or in decline.
- All Sector Stats: An “at-a-glance” table of total market cap, TVL, and trading volume for every sector, along with their 24-hour changes.
Updated about 1 year ago