
Dashboard - Metrics
The Metrics Dashboard in Birdeye Data Services (BDS) provides visibility into your API performance and compute unit (CU) consumption. This section is essential for developers, analysts, and operations teams who need to monitor how APIs are being used, detect potential issues, and optimize integration efficiency.
Whether you're tracking live WebSocket activity or historical REST API usage, the Metrics Dashboard enables you to break down key usage patterns by method, status code, and latency.
🔁 Select API Type
- Toggle between APIs and WebSocket tabs at the top to choose the data stream you wish to monitor.
- ⏱ Choose Time Range
- Use the time filter to adjust your view:
- 1H – Last 1 Hour
- 1D – Last 24 Hours
- 7D – Last 7 Days
- 30D – Last 30 Days
- Use the time filter to adjust your view:
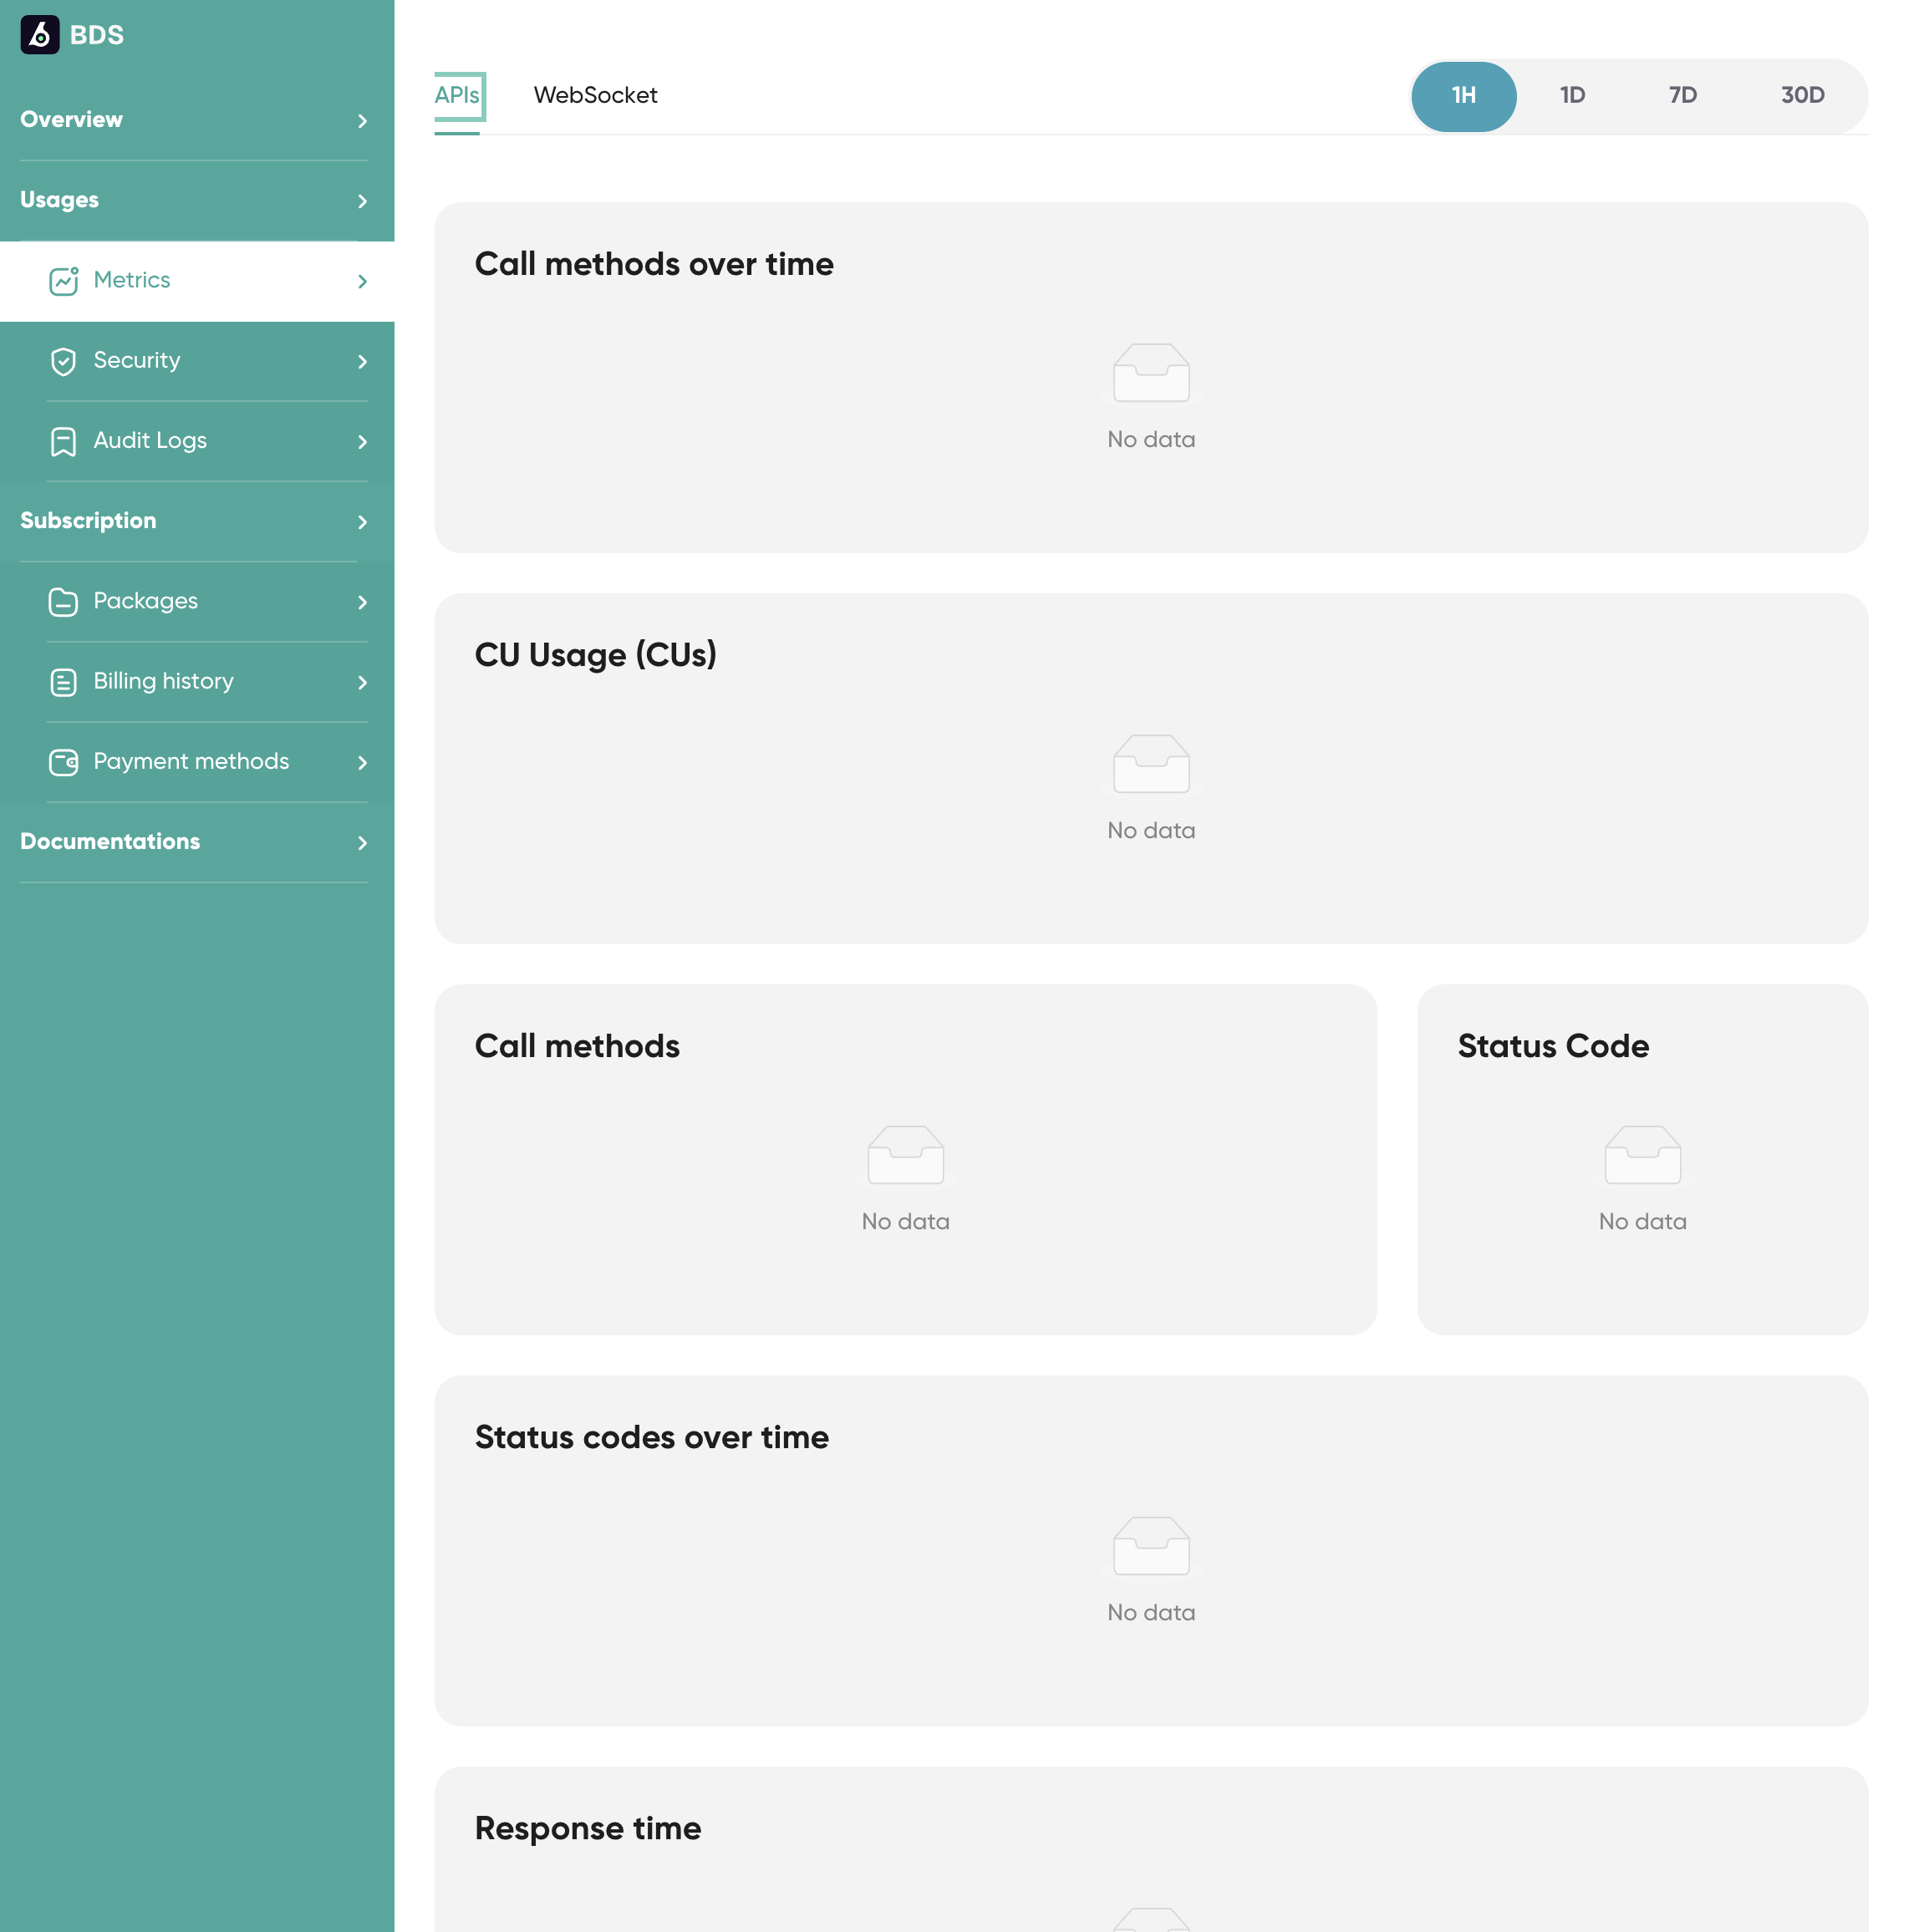
📈 Metrics Overview (Panels Explained)
- Call Methods Over Time
Visualizes the frequency of different API methods (e.g., /price, /pair) over your selected time range. - CU Usage (Compute Units)
Shows compute unit consumption trends, helping you track and optimize costs. - Call Methods
Displays a summary of the API methods being used, sorted by usage frequency. - Status Code Distribution
Breaks down HTTP status codes (e.g., 200, 400, 500) to help you identify failed or errored calls. - Status Codes Over Time
Allows you to monitor the health of your API traffic with a timeline of status code occurrences. - Response Time
Provides an average response time for your API calls—key for tracking performance and latency.
⚠️ No Data Displayed?
If you’re seeing “No data”:
- Confirm that your API calls have been made during the selected time range.
- Ensure your API keys are correctly configured and in use.
- Check that the correct data stream (API or WebSocket) is selected.
Updated about 1 year ago
What’s Next
Did this page help you?